Starting Point
To specify your desired starting point of the analysis you have to use the input form at the STRING start page.
- Protein by name
- Protein by sequence
- Multiple proteins
- Multiple sequences
- Organisms
- Protein families (COGs)
- Examples
- Random entry
You can search STRING by single protein name, multiple names or by amino acid sequence (in any format) There are also example inputs and a random input generator which will randomly select a protein with at least 4 predicted links at medium confidence or better. There is a organism entry to see if your species of interest is available. There is the possibility to search by protein family rather than a protein in a single organism, by searching the COGs (clusters of orthologous groups)
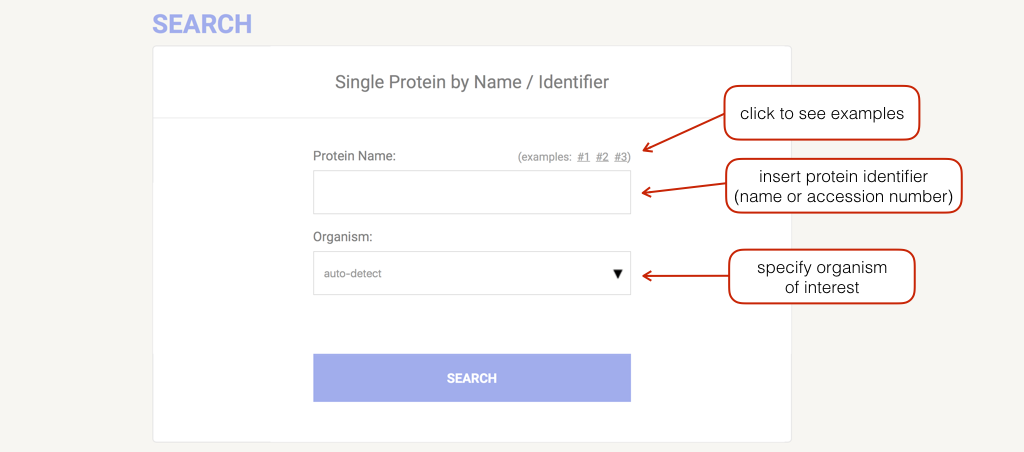
Commonly, you enter your protein of interest by supplying its name or identifier. The organism can be selected by clicking on the arrow or directly typing the name inside the relative input field (an autocompletion mechanism will appear to help you). General names that group more than one organism (e.g. "Mammals", "Chordata") can also be used.
Network
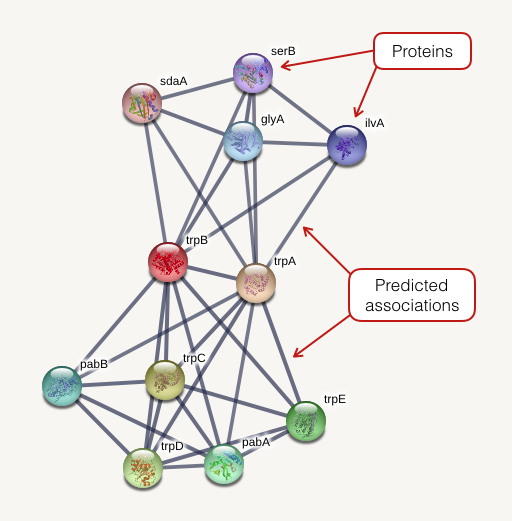
The network view summarizes the network of predicted associations for a particular group of proteins. The network nodes are proteins. The edges represent the predicted functional associations. The edges are draw according to the view settings. In evidence mode, an edge may be drawn with up to 7 differently colored lines - these lines represent the existence of the seven types of evidence used in predicting the associations.
- Red line - indicates the presence of fusion evidence
- Green line - neighborhood evidence
- Blue line - cooccurrence evidence
- Purple line - experimental evidence
- Yellow line - textmining evidence
- Light blue line - database evidence
- Black line - coexpression evidence.
In confidence mode the thickness of the line indicate the degree of confidence prediction of the interaction. Action mode show additional information about the prediction, such as, binding, activation, etc.
Clicking on a node gives several details about the protein. Clicking on an edge displays a detailed evidence breakdown.
A note on the network drawing algorithm
STRING uses a spring model to generate the network images. Nodes are modeled as masses and edges as springs; the final position of the nodes in the image is computed by minimizing the 'energy' of the system. We give high confidence edges a higher 'spring strength' so that they will reach an optimal position before lower confidence edges. The user also can optionally reduce the 'natural length' of a high confidence edge - this forces them closer together and sometimes results in a clearer picture of high confidence interactions. We set the high confidence edge length to 80% of the normal length by default.
This modeling has some important consequences that the user should be aware of. Firstly, the physical distances between two nodes along an edge in a graph has no meaning; indeed, an attempt to set the edge length based on score would probably result in an unsolvable set of equations! We try to ensure high confidence links are drawn close together through the setting of the modeling parameters described above. Secondly, although the algorithm is deterministic - the same input will produce the same output - the addition of, say, new nodes to the network can result in node locations in the new image completely changing. Finally, although the input node is the 'center' of the network in an abstract sense, it may not be located centrally in the network image.
Navigation Buttons
The navigation take you to different aspects of the data, allowing you change parameters and to see the different types of evidence that supports the predicted associations.

Legend Top ↑
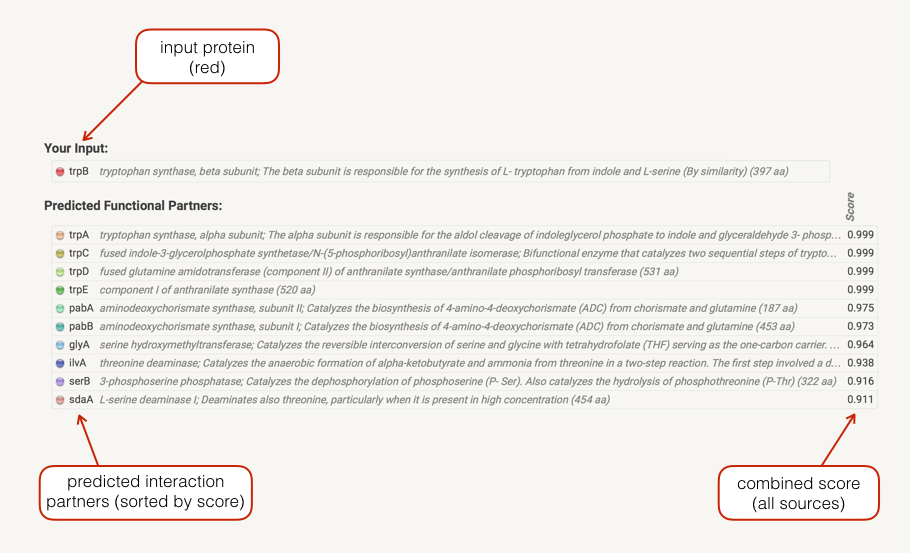
In the Legend section a list your input(s) is shown. Predicted associations are shown immediately in a list below your input, sorted by score. If input gene is a fusion of two functions, both will be shown. Clicking on the score bullets gives you a breakdown of the individual prediction method scores. Clicking on a gene name gives you the protein sequence as well as a list of similar proteins in STRING. Initially, only predictions with medium (or better) confidence, limited to the top 10 interactors will be shown. These parameters can be changed in the data settings.
Data Settings Top ↑
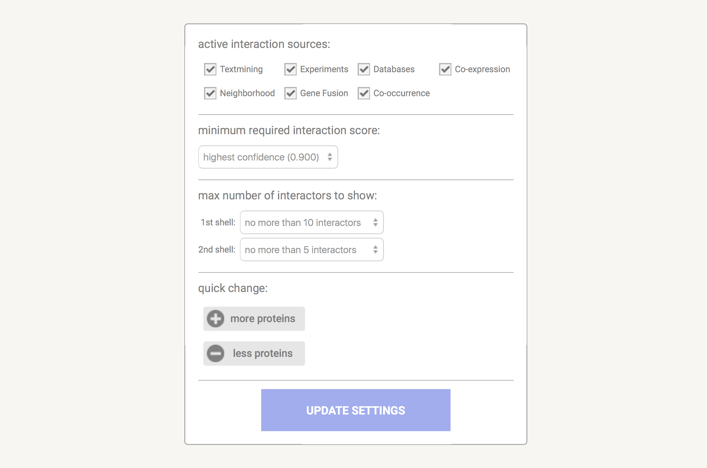
In the data settings you can change the parameters that influence the output. Note that parameters are only changed when you press the 'Update Settings' button.
Under the active interaction sources you can select which type of evidence will contribute to the prediction of the score.
The minimum required interaction score puts a threshold on the confidence score, such that only interaction above this score are included in the predicted network. Lower score mean more interaction, but also more false positives. The confidence score is the approximate probability that a predicted link exists between two enzymes in the same metabolic map in the KEGG database. Confidence limits are as follows:
- low confidence - 0.15 (or better),
- medium confidence - 0.4,
- high confidence - 0.7,
- highest confidence - 0.9.
You can choose the max number of interactions to show. This is an option to limit the number of interactions to your input. The default setting is to limit the output to the 10 best-scoring hits.
There is a options the set how many interactions are shown that directly connect with your input by setting the 1st shell and how many indirect interaction that connect to a protein in the first shell by setting the 2nd shell. Please note that this can result in fairly large networks that may take a while to compute and download.
Note that you can click on any node, and the subsequent page offers a link to use that node as the input - effectively placing it in the center of the image. Repeated use of this mechanism allows you to explore large regions of the network.
You have the convenient option the change the parameter setting by pressing either of the buttons und quick change.
View Settings Top ↑

The dialogue box shown above is the one for the Network View. Network specific parameters are: 'edge scaling factor' - this reduces the length of high-scoring edges so that the images will be drawn more compact, and low scoring hits will be spread out further. Lower values mean more compact images, higher values will cause more spread.
Here you can select the meaning of network edges of the displayed network. You can choose between:
- evidence - multiple lines where the color indicates the type of interaction evidence
- confidence - line thickness indicates the strength of data support
- molecular action - line shape indicates the predicted mode of action
The network display mode gives you the option to change the format of the displayed network. The options are:
- static png - image of network is a simple bitmap image that is not interactive
- interactive svg - network is a scalable vector graphic [SVG] and provides interactivity
- interactive flash - network is displayed in a Flash-applet, which allows for functionality not (yet) implemented in svg mode (e.g. clustering)
Finally, you can disable structure previews inside network bubbles by checking the check-box protein structure information.
Tables / Exports Top ↑
In this section you can export your current network to the following formats:
- bitmap image - image of the network in the PNG (portable network graphic) file format.
- high-resolution bitmap - image in PNG format, at resolution 400 dpi
- vector graphic: - image in SVG (scalable vector graphic) format that can be opened and edited in Illustrator, CorelDraw, Dia, etc.
- simple tabular text output - data for the interaction network as tab separated values (TSV format). File can be opened in Excel. This data is also show further down on Table/Export page.
- XML summary - interaction data in a structured XML data format, according to the 'PSI-MI' data standard
- network coordinates - a flat-file format describing the coordinates and colors of nodes in the network
- protein sequences - MFA: multi-fasta format, containing the amino acid sequences in the network
- protein annotations - a tab-delimited file describing the names, domains and annotated functions of the network proteins
Evidence Top ↑
Conserved Neighborhood
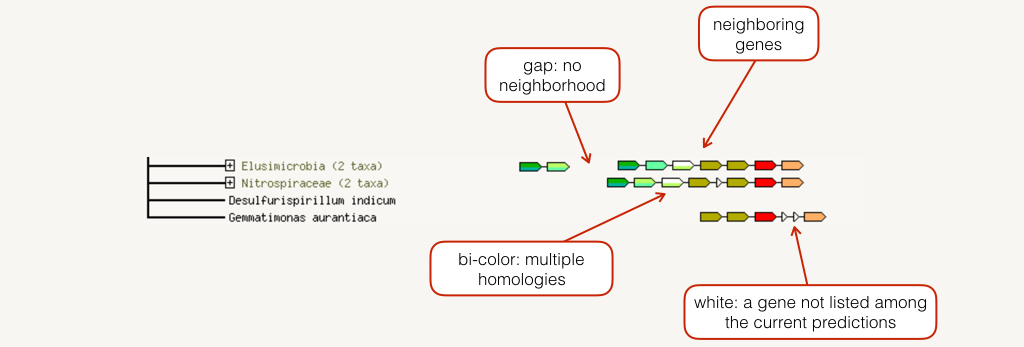
The neighborhood view shows runs of genes that occur repeatedly in close neighborhood in (prokaryotic) genomes. Genes located together in a run are linked with a black line (maximum allowed intergenic distance is 300 base pairs). Note that if there are multiple runs for a given species, these are separated by white space. If there are other genes in the run that are below the current score threshold, they are drawn as small white triangles. Gene fusion occurrences are also drawn, but only if they are present in a run (see also the Fusion section below for more details).
Co-occurrence
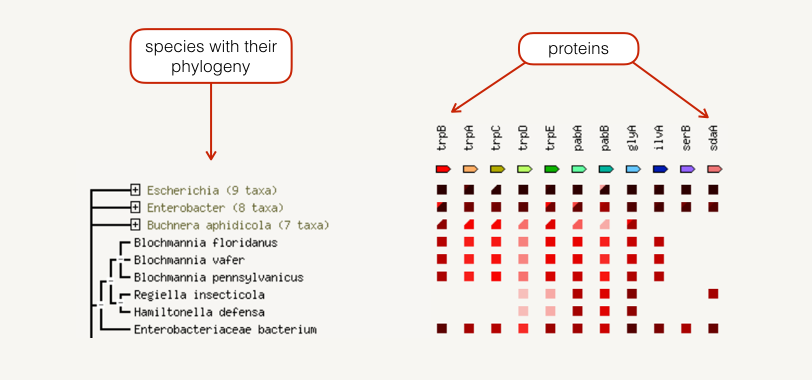
The occurrence view shows the presence or absence of linked proteins across species. Proteins are listed across the top of the page and a phylogenetic tree with species names is listed down the left hand side. In the subsequent grid, the presence of the protein in a species is marked with a red square and absence with a white space. The intensity of the color of the red square reflect the amount of conservation of the homologous protein in the specie.
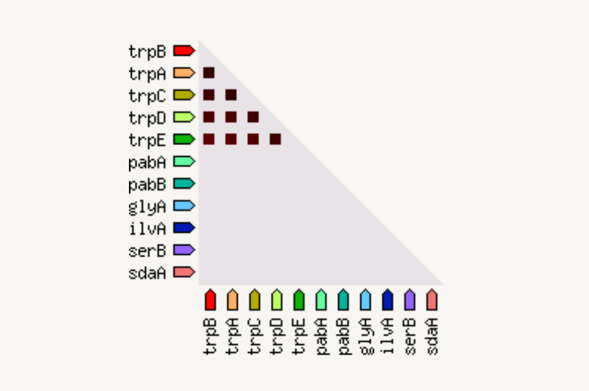
Fusion
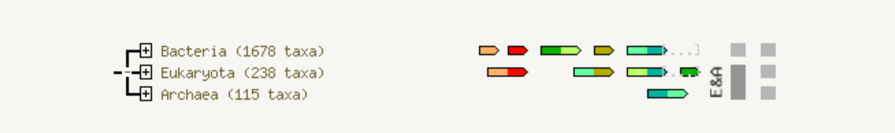
The fusion view shows the individual gene fusion events per species. The species in which fusion occurs are listed to the left. Genes are colored according to the table at the bottom of the page. White genes are those which are fused but not directly linked to the input at the selected confidence level. Hovering above a region in a gene gives the gene name; clicking on a gene gives more detailed information.
Co-expression
The coexpression view shows the genes that are co-expressed in the same or in other species (transferred by homology). Co-expression is shown by a red square: more intense color of the square represent a higher association score of the expression data.
Experiments

The experiments view shows a list of significant protein interaction datasets, gathered from other protein-protein interaction databases. The name of the database is present in the grey header of the table: you can get more information on the group, clicking on the "info" link. Below the header, the organism is reported together with the proteins of the network that are present in this group.
Databases

This view shows a list of significant protein interaction groups, gathered from curated databases. You can get more information on the group, clicking on the "info" link on the grey rows. Clicking the bubbles next to their respective gene names give information of the individual proteins.
Text mining

The text mining view shows a list of significant protein interaction groups, extracted from the abstracts of scientific literature. The title and the abstract of the publication are displayed together with a link to the publication.
Analysis Top ↑
The analysis section give some brief statistics of the inferred
network, such as the number of nodes and edges. The average node
degree is a number of how many interactions (at the score threshold)
that a protein have on the average in the network. The clustering
coefficient is a measure of how connected the nodes in the network are.
Highly connected networks have high values.
The expected number of edges gives how many edges is to be expected if the nodes were to be selected at random. A small PPI enrichment p-value indicate that the nodes are not random and that the observed number of edges is significant. Note that is some cases enrichment is to be expected and that there numbers have to be interpreted with some caution.
There is also an enrichment analysis for Gene Ontologies, pathways and domains. Basically, this shows term that are more enriched in the set of proteins in the network than the background.